A New Way to Access Your Boundary Maps in Articque Online and Articque Platform
The Articque solution has fundamentally evolved the way you access your boundary maps databases (administrative boundaries, study zones, country outlines, provinces…) to create and configure your cartographic analyses.
Sommaire
Your new Articque DataMarket Cartographic Databases
Tutorial 1 – Create a DataComposition to import a boundary map
Tutorial 2 – Import an Articque DataMarket boundary map into a DataComposition
Tutorial 3 – Use a DataComposition and its boundary maps in your workflows
Why this change?
Until now, your French and worldwide administrative boundaries, known as “Carticque bases”, were provided as GeoJSON files to be imported manually into each diagram. These GeoJSON files were organised across a series of subfolders, with numerous files for each year.
While familiar, this method came with several constraints:
- Navigating a complex folder structure with files that had unclear names..
- Multiplying operations to build your own territories, especially across areas spanning several regions/districts.
- Numerous manual steps at each annual update to refresh your work.
- Limited options to enrich the Carticque bases, so as not to increase the complexity of the folder structures (and disk space usage on Articque Platform).
The Articque DataComposer and DataMarket features now resolves these constraints. Their goal is clear: to become the centralised entry point for all your geographic and statistical data (your own or provided by ChapsVision) to simplify your day-to-day work.
Your New Articque DataMarket Cartographic databases
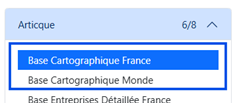
All your boundary maps are now grouped and accessible from the Articque DataMarket data catalogue
- Under the new names “Base Cartographique France” and “Base Cartographique Monde”, including all yearly releases since 2017.
- New yearly releases will no longer be delivered as GeoJSON files.

DataComposer becomes the main entry point for using your boundary maps
- Via the Articque DataMarket module in your DataCompositions on Articque Online and Platform.
Always up-to-date boundary maps, for everyone
- New yearly releases will appear automatically in the Articque DataMarket catalogue, with no action required on your part and without delay.
- Updating a single DataComposition can refresh all your workflows in one operation.
Richer and more complete bases
- In addition to Administrative and IRIS boundaries, the Base Cartographique France now includes study zones (EPCI, Urban Units…), INSEE grid squares (200m, 1km…) and the land registry (buildings, parcels…).
- The Base Cartographique Monde now contains 5 levels, from countries down to municipalities.
- Boundaries are often available in 2 versions: “Simplified geometry” (for faster web display) or “Raw geometry” (for greater precision).
More flexible and faster preparation, for greater customisation
- No more need to assemble numerous GeoJSON files in each workflow to recreate your own territory! Articque DataMarket filters and DataComposer features let you select and extract any type of territory in just a few clicks, even if it spans several regions/districts.
- You can preview the entities in your selected boundary map as a table or a map.
In Practice
For your new projects
- We recommend creating a main DataComposition called “My Boundary Maps” (see Tutorial 1).
- Inside it, use Articque DataMarket Import modules to select and import all the boundary maps you use regularly. Final Table modules make them visible to your workflows (see Tutorial 2).
- In your workflows, replace the traditional Map modules with DataComposer modules to connect to your DataComposition (see Tutorial 3).

For your existing projects
- Most importantly: your existing projects will continue to work without interruption!
- We are not cutting off any access. Only projects that require an update to more recent boundary maps will require action on your part.
- When you wish to update the administrative boundaries in your older projects with new yearly releases:
- We recommend adapting them as well, by replacing their Map modules with DataComposer modules, connected to DataCompositions, just as for your new projects (see Tutorials).
- This change requires adjusting your working habits on these existing projects. The update cannot be automated: manual intervention will be required to adjust the data sources.
- An alternative solution still allows you to export boundary maps from Articque DataMarket as GeoJSON files (see Tutorial 4).
Résumé
| Before | Now |
| Files to be imported manually | Centralised access via Articque DataMarket and DataComposer |
| Limited yearly updates and enrichments | Automatic updates and enrichments throughout the year |
| Complex folder structures | Single, clear, ergonomic and filterable interface |
|
Multiple imports to create custom territories |
Selection, filtering and preparation in Articque DataMarket and DataComposer |
Tutorial 1 – Create a DataComposition to Import a boundary map
In Articque Online or Articque Platform
- From the home page, your personal space or in a workgroup, click the “DataComposition +” button to create a new DataComposition.
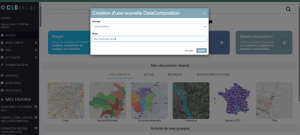
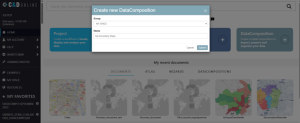
2. Choose its location (selection list “Group”) and give it a recognisable name.
3. Open your DataComposition.
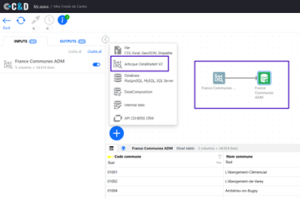
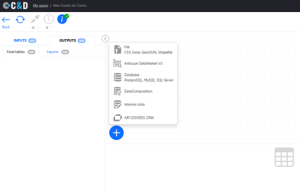
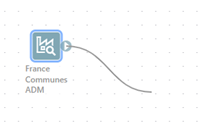
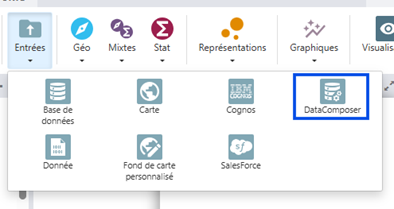
4. In the workflow area, click the “+” button and add a new Articque DataMarket source module.
5. That’s it: everything is ready to start creating your boundary map!
Tutorial 2 – Import an Articque DataMarket boundary map into a DataComposition
1. In your DataComposition, double-click on the Articque DataMarket source module to open its settings.
2. The cartographic bases available to you appear on the left in the Source column. NB: some bases are available by subscription only (shopping cart icon), but you can still browse a preview of their content.
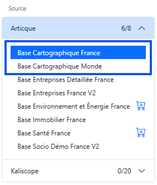
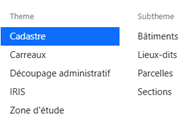
3. Start by selecting the cartographic base of your choice (France or Monde).
4. Then select the theme (geographic boundary category), the sub-theme (administrative/study boundary level), the year (the year of the boundary) and the mesh (the type of geographic unit corresponding to the chosen boundary).
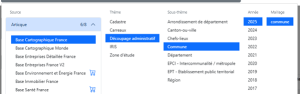
Example: selecting the official INSEE 2025 French municipal boundaries
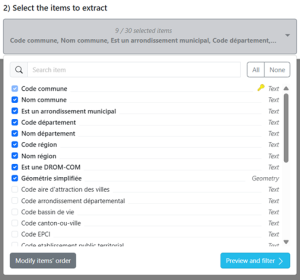
5. Now click the “Select indicators” button”
6. The next view lets you select the indicators. Indicators are the columns of your boundary map table containing the Identifier (e.g. INSEE Municipality code, IRIS code…), the Name, the Geometry (points, lines or polygons) of the entities, and other information.
- Select the indicators you need (the main indicators are pre-selected).
- The identifier (unique key) is mandatory and cannot be deselected.
- You must check at least one Geometry column (simplified or raw).
- You can also select indicators useful for filtering the content of your boundary map: region codes, department names…
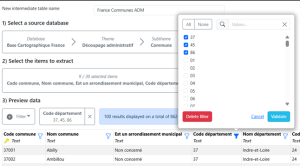
7. Then click the “Preview and filter” button: a preview of the table (100 entities) of your basemap in progress and its total number of entities will appear.
- You can use the various filters to refine your selection and create composite territories (the total number of entities updates automatically).
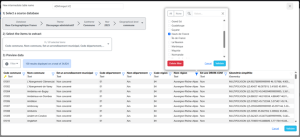

8. When the selection suits you, click “Validate” to import your boundary map into a DataComposer table.
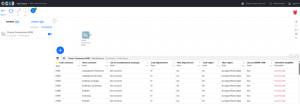
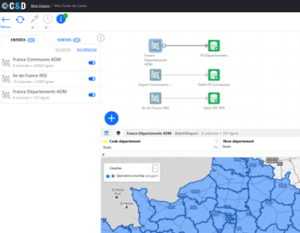
9. The Table and Map views let you easily visualise excerpts of your boundary map in your DataComposer table.
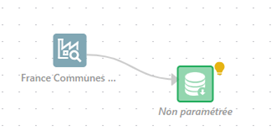
10.You now need to make your DataComposer table “visible” to your workflows, in the form of a Final Table (a view of your data accessible to your workflows): drag a link from the connector of your Articque DataMarket module and release it.
11. From the list of compatible modules, select a Final Table module
12. Configure your final table: you can rename it and choose and rename the columns you keep. Important: you must keep at least one geometry column.
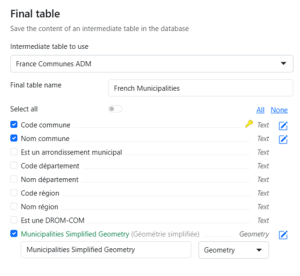
13. Cliquez sur Valider : c’est terminé ! Votre DataComposition et votre fond de carte est prêt è l’emploi pour tous vos organigrammes
Tutorial 3 – Use a DataComposition and Its boundary map in Your workflows
- Create a new Project or open one of your existing Projects.
- From the “Sources” menu, add a DataComposer module to your workflow.
3. Open the settings of the DataComposer module and click “Choose” to find your DataComposition.

4. Then select the final table of your DataComposition that contains your boundary map and its columns in the DataComposer module (at minimum, the identifiers column and the geometry column).

5. Click Validate: you’re done!
6. Your DataComposer module now contains your boundary map and replaces your old Map modules and GeoJSON files.
7. Your DataComposer module can be connected to a Strokes module (or other representations), to Data modules, databases, operators… to create and configure all your analyses.

Tutorial 4 – Export a boundary map in GeoJSON Format
1. Start by following Tutorials 1 and 2 to create a DataComposition and import your boundary map from Articque DataMarket.
2. In your DataComposition, from the output of your Articque DataMarket module, drag a link and add an “Export GeoJSON” output module.
3. Configure the “Export GeoJSON” module by specifying, in particular, the name and then the location of the file to be generated, and the geometry to use. NB: you can also select and rename the columns of your future GeoJSON file.
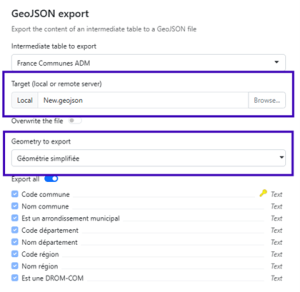
4. Click Validate: you’re done! Your GeoJSON file is now exported and available at the location you chose.
FAQ
Q: I still use Articque Desktop — how should I proceed?
A: Articque Desktop remains compatible only with GeoJSON files and cannot connect to Articque DataMarket.
We recommend following Tutorials 1 and 4 to export your usual boundary maps as GeoJSON files from Articque DataMarket and DataComposer.
Q2: My Articque Platform On-Premises installation cannot connect to the Internet and therefore cannot connect to Articque DataMarket (blocked by our security rules). How should I proceed?
A: For this very specific type of Articque Platform installation, the Base Cartographique France and Monde products will be delivered directly within the platform as ready-to-use DataCompositions.
These DataCompositions contain pre-configured tables with the boundary maps for the various administrative boundaries. You can refer directly to Tutorial 3 to create your cartographic analyses.
