FIFA World Cup statistics in maps
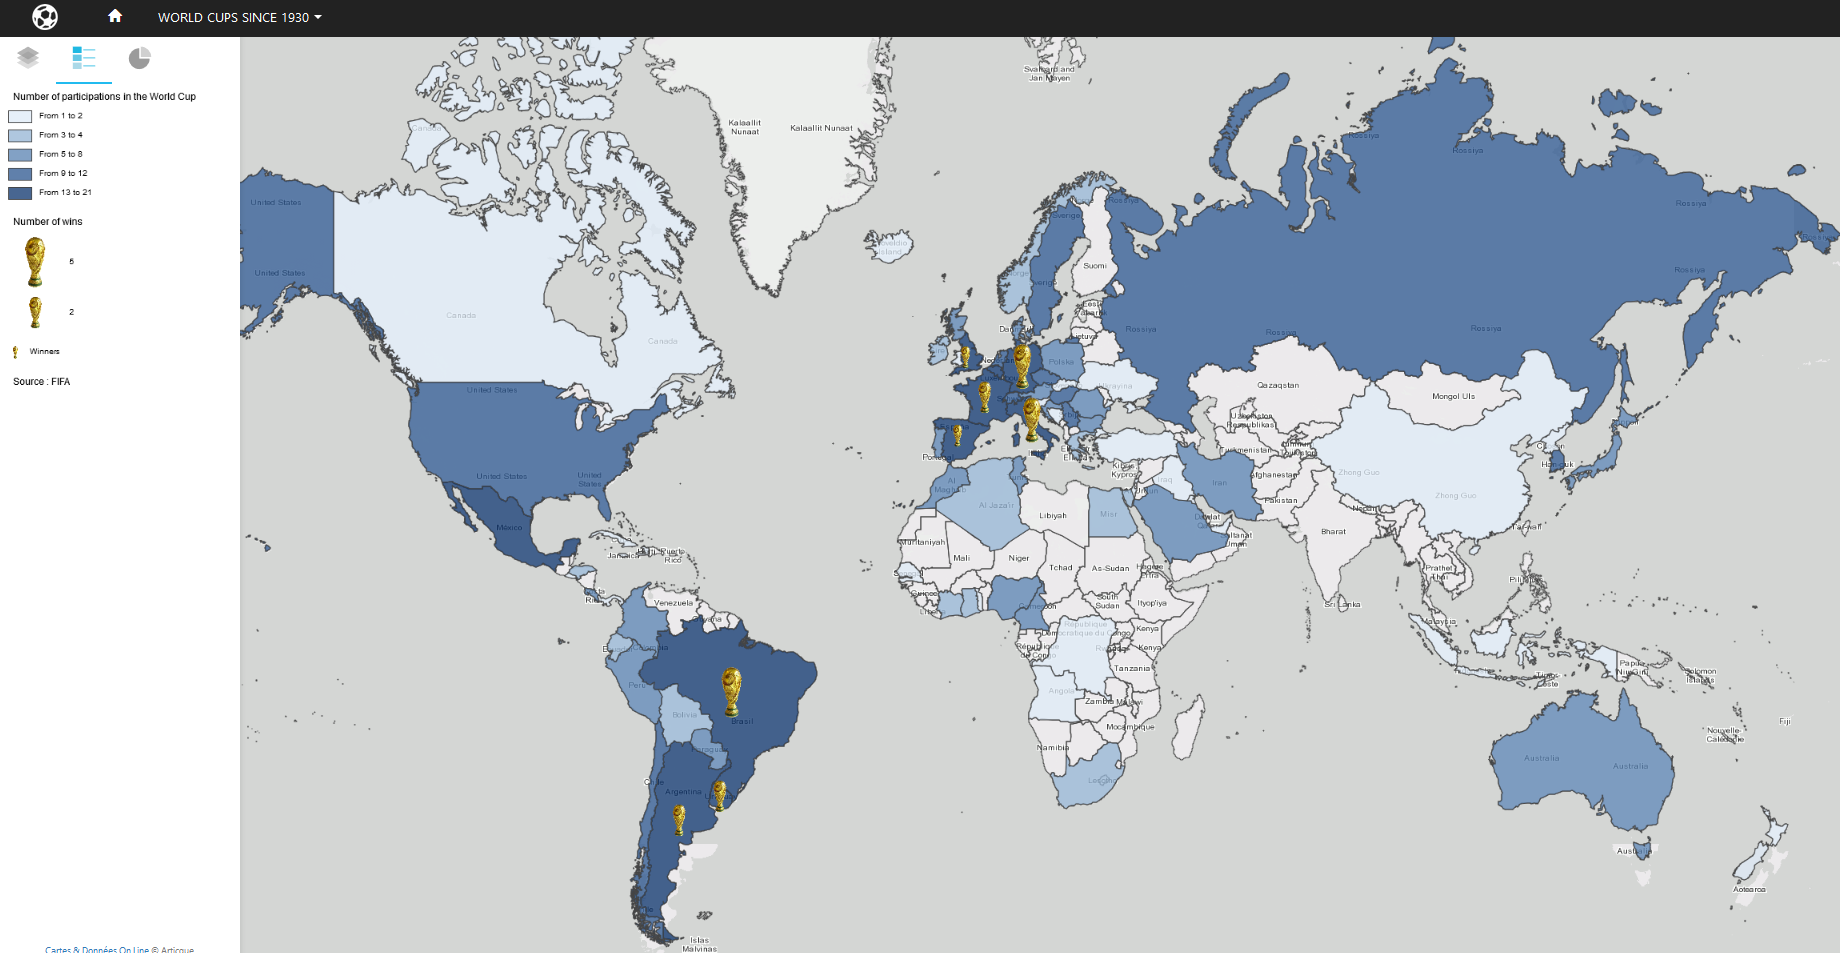
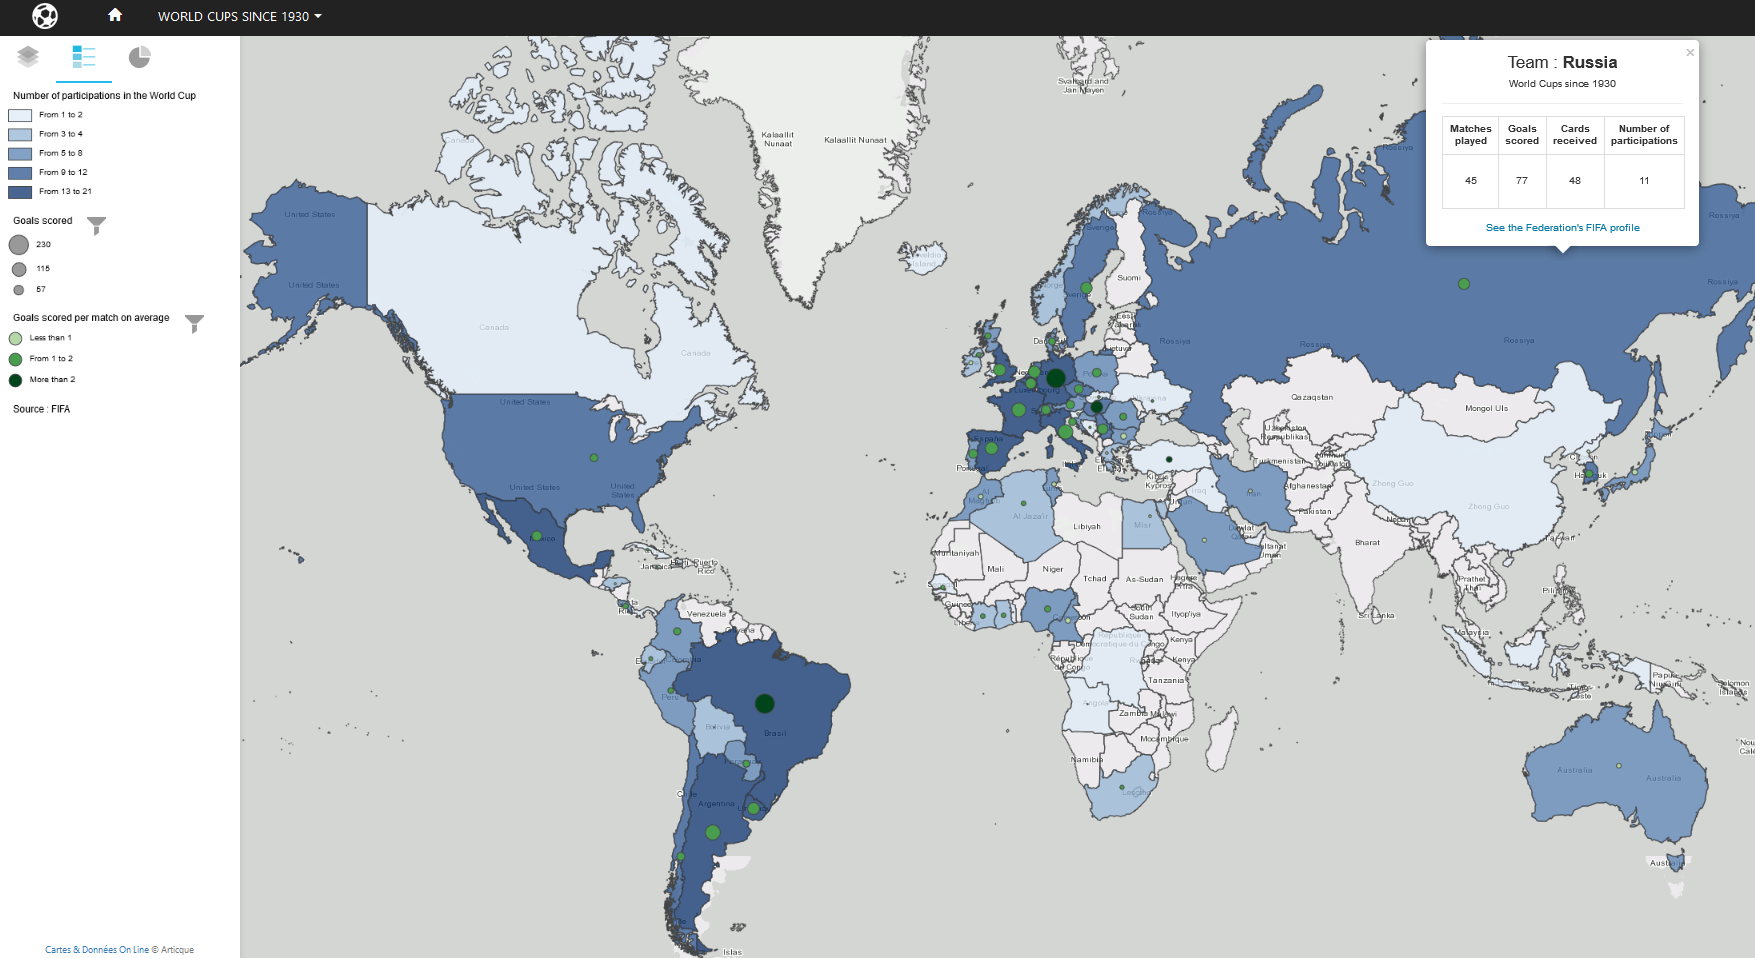
Enjoy the FIFA World Cup for a little longer by rediscovering the remarkable statistics of the tournament! The interactive atlas below lets you navigate among the figures of the 2018 World Cup, and among the total figures of all World Cups since the competition was created in 1930.
Make your own map!
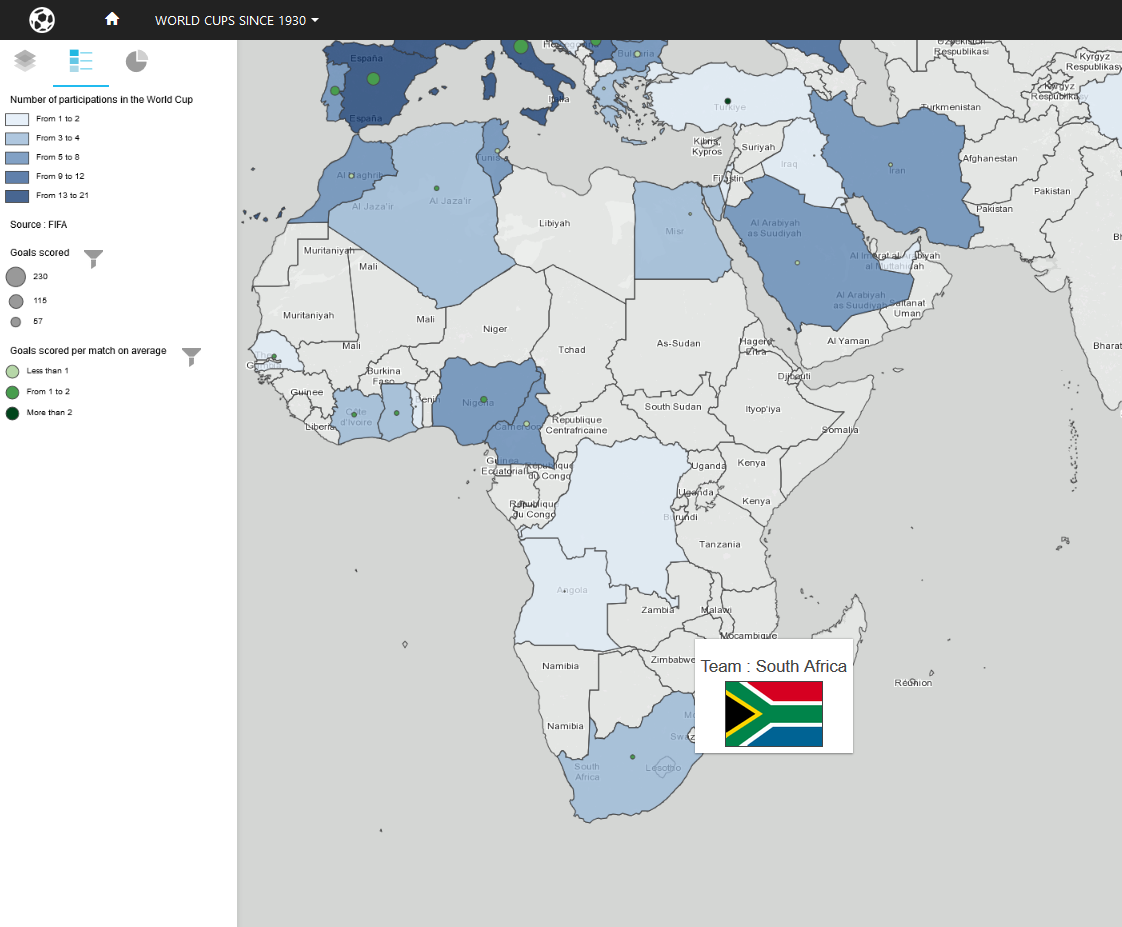
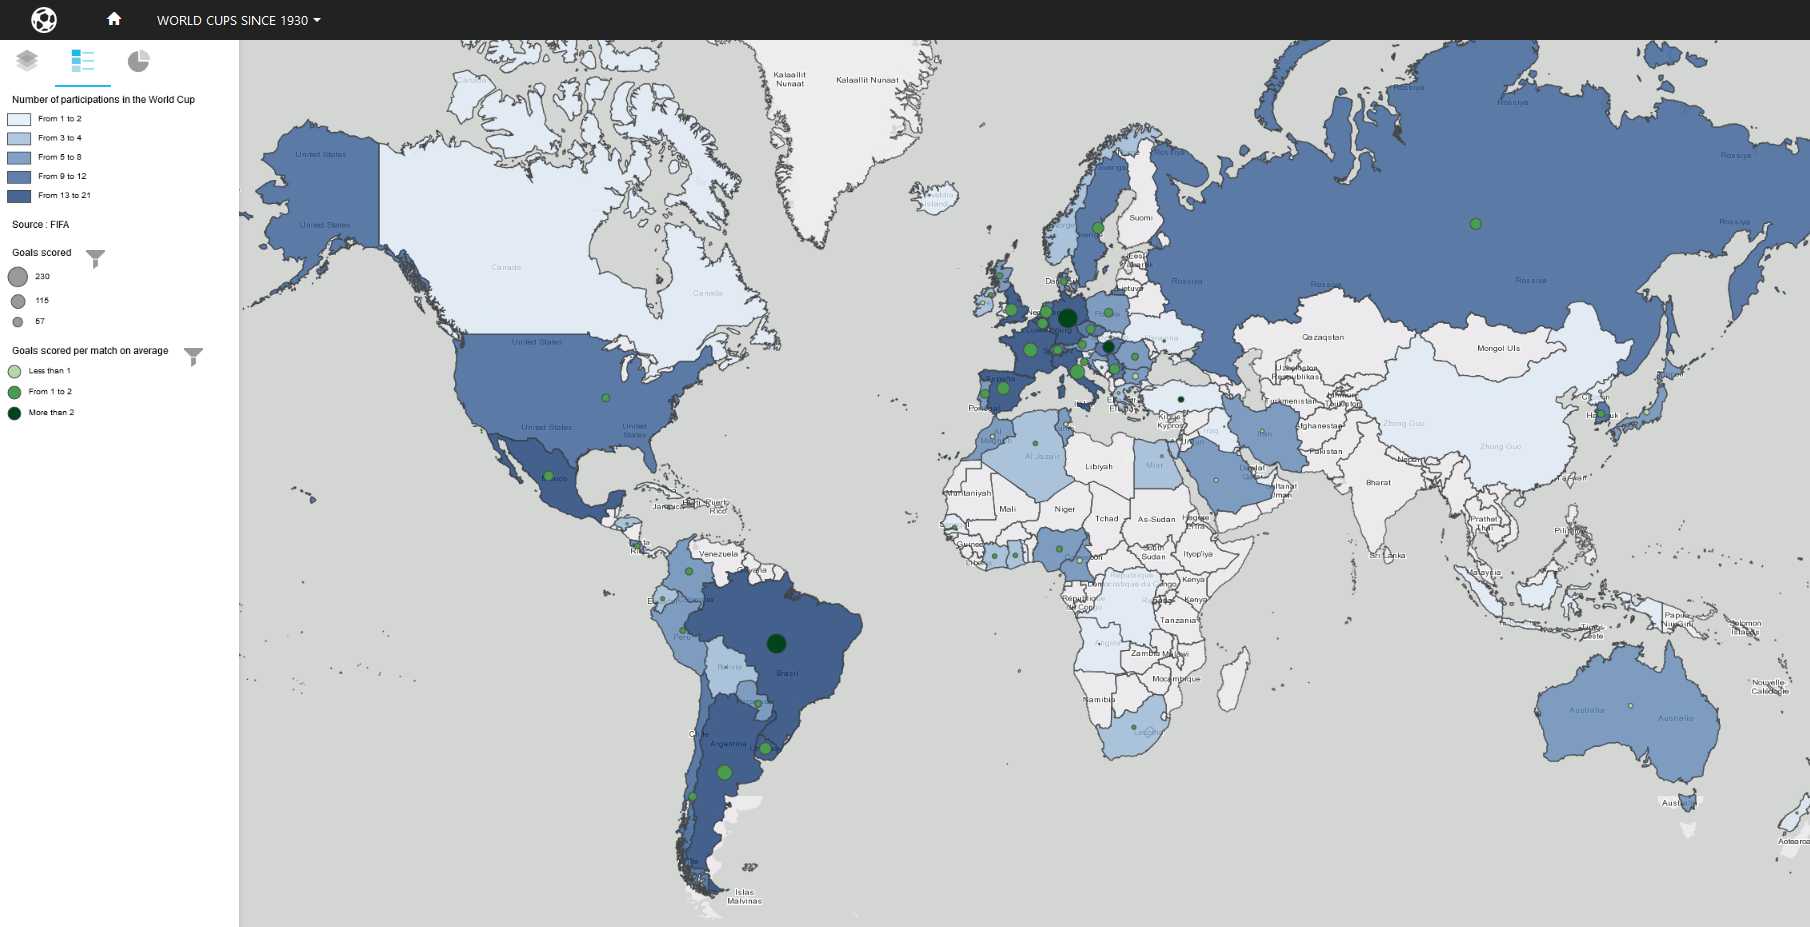
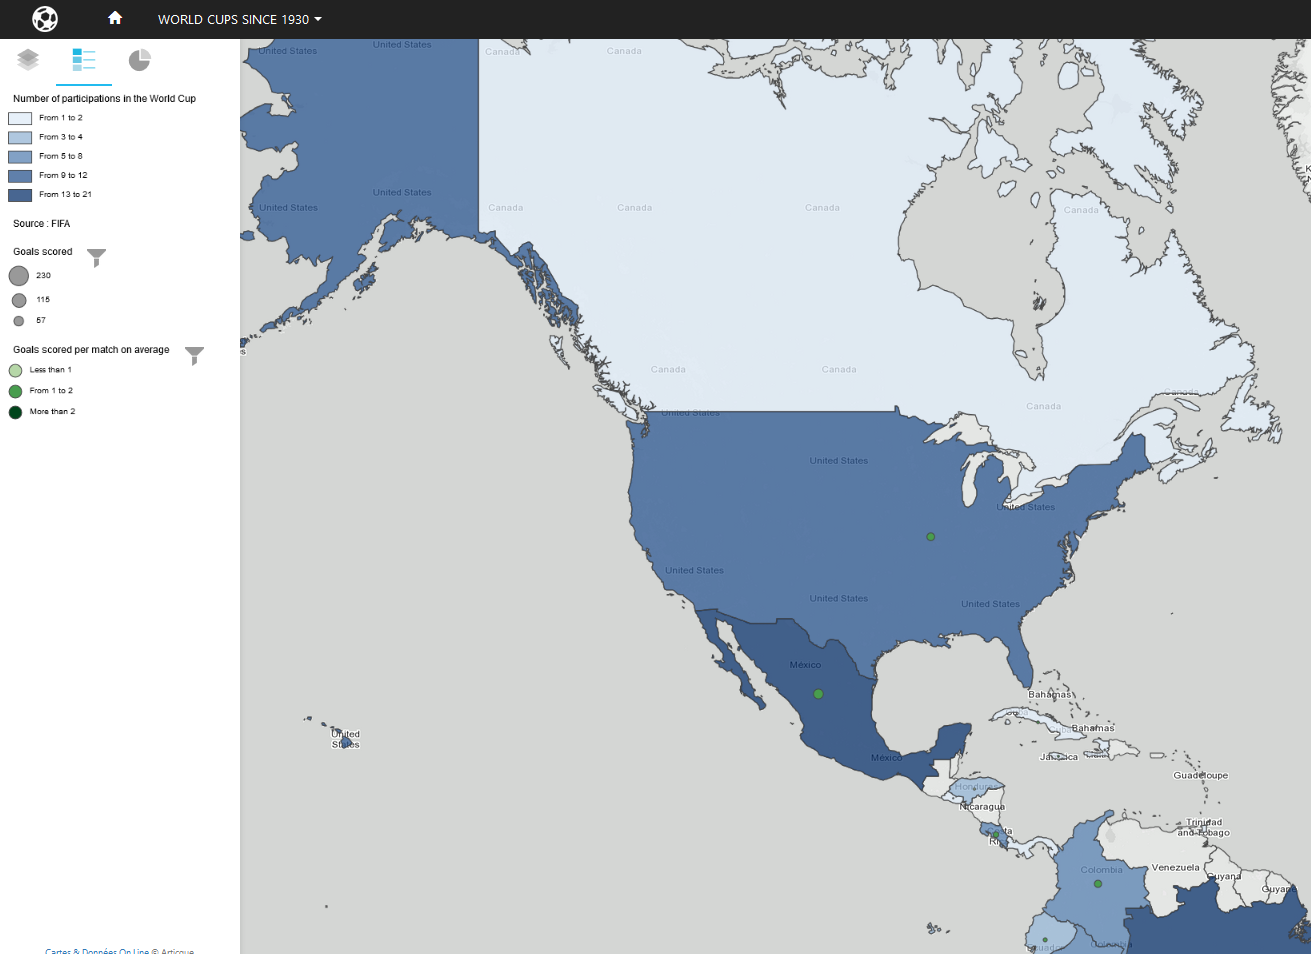
At the top of the atlas, you can choose between the 2018 World Cup and the total figures of World Cups since 1930.
Choose the information you wish to display: number of goals, of cards,…
Filter the information on the map: countries who scored more than 10 goals, who received less than one card per match on average…
Visualize the legend.
See graphs.
Export your map.
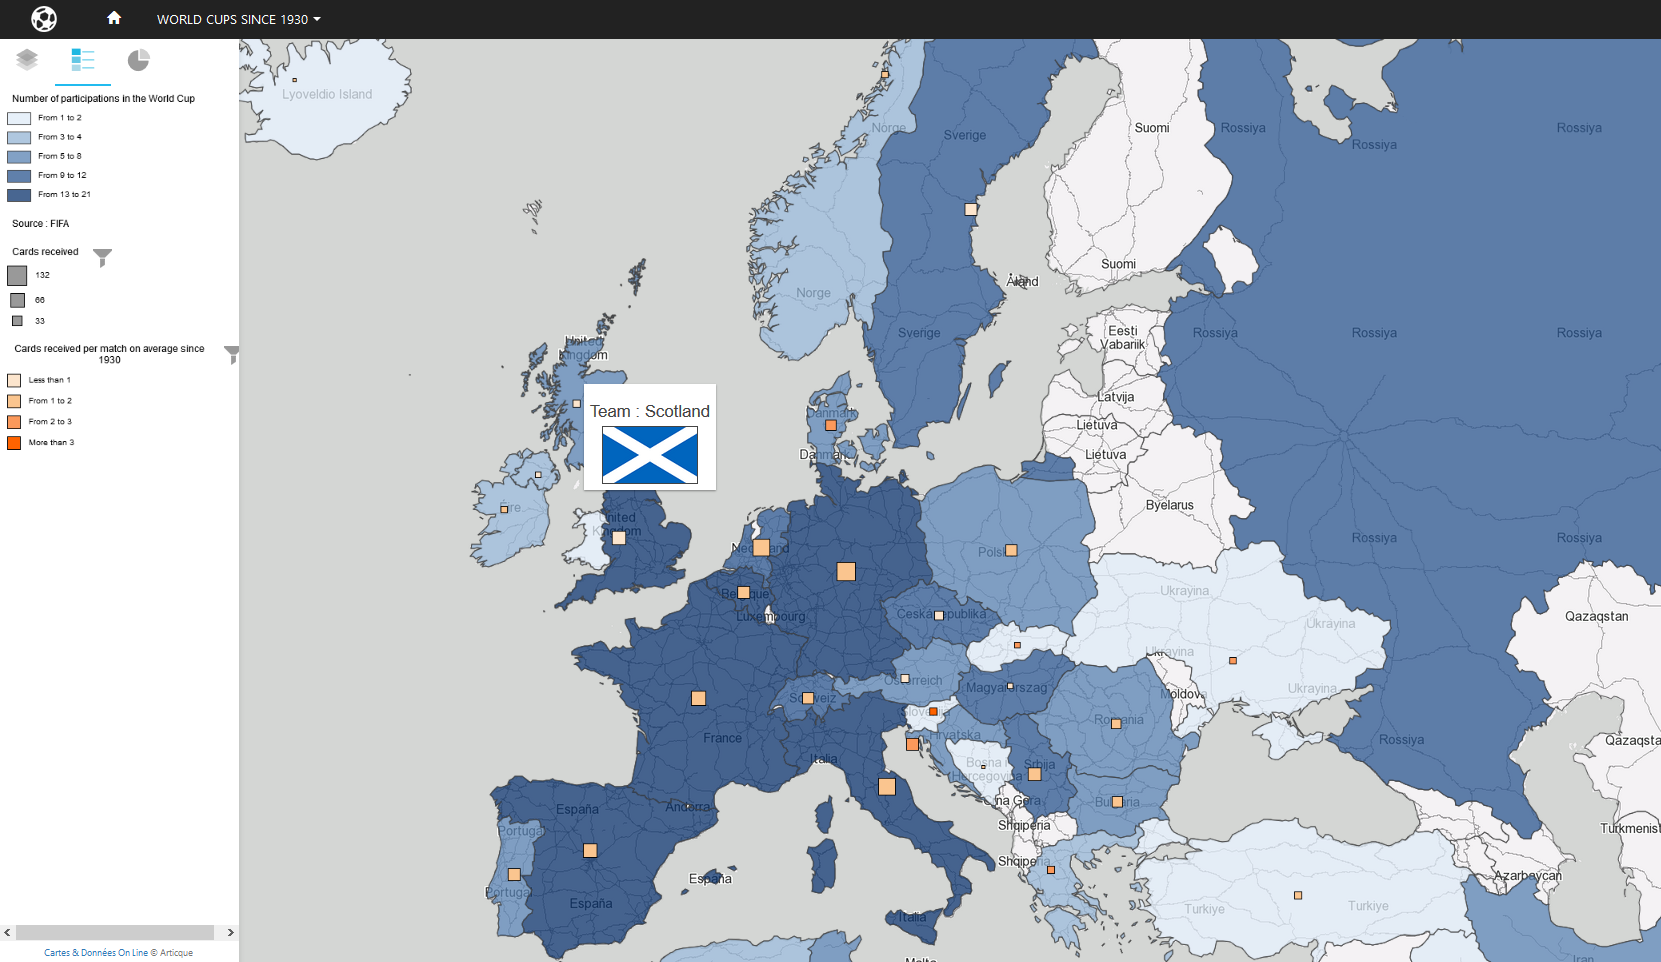
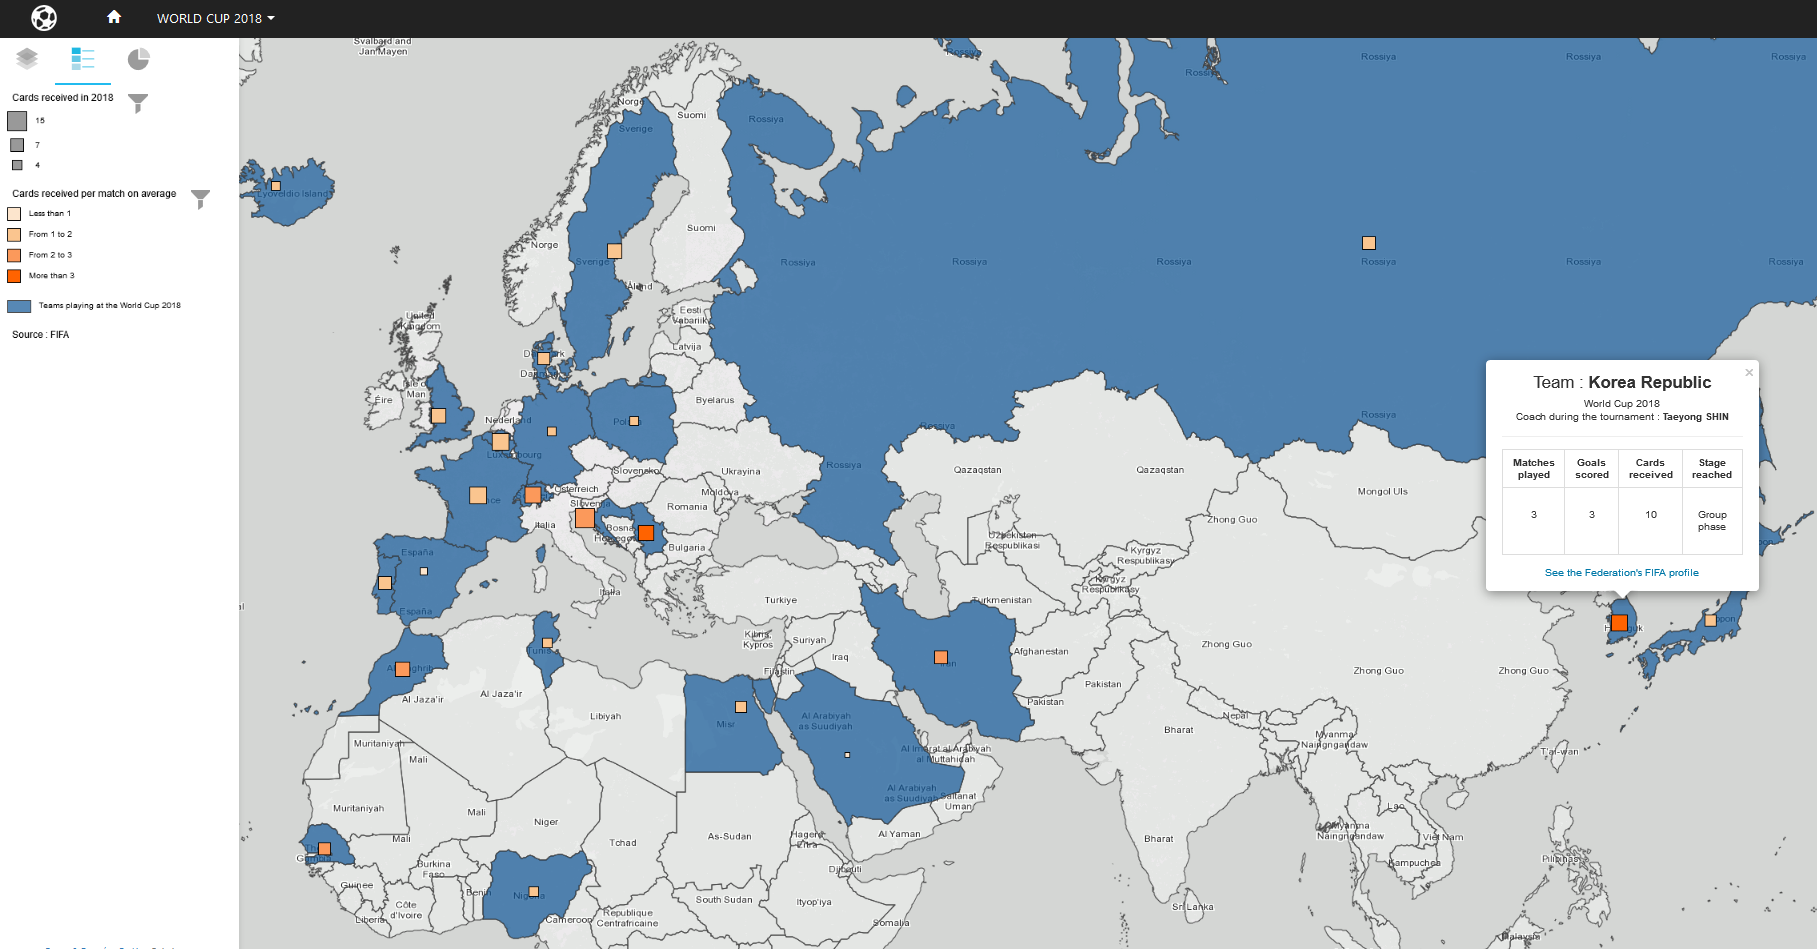
Move your mouse over the map to display a tooltip with the name and flag of each country; click on a country to see a data sheet containing key information: figures, link to the FIFA sheet of its federation, name of the coach for the 2018 World Cup…
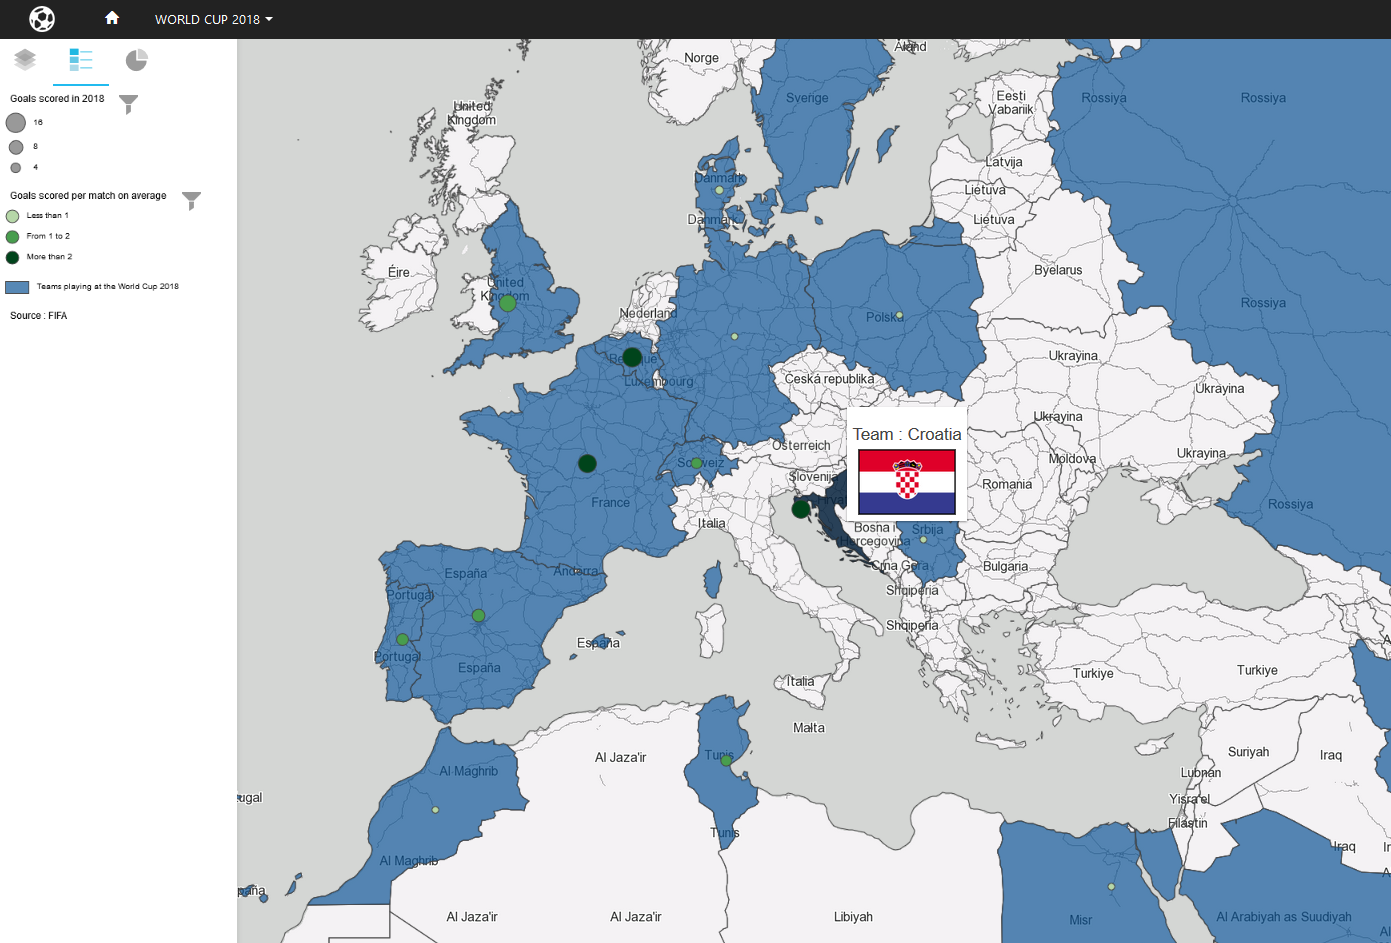
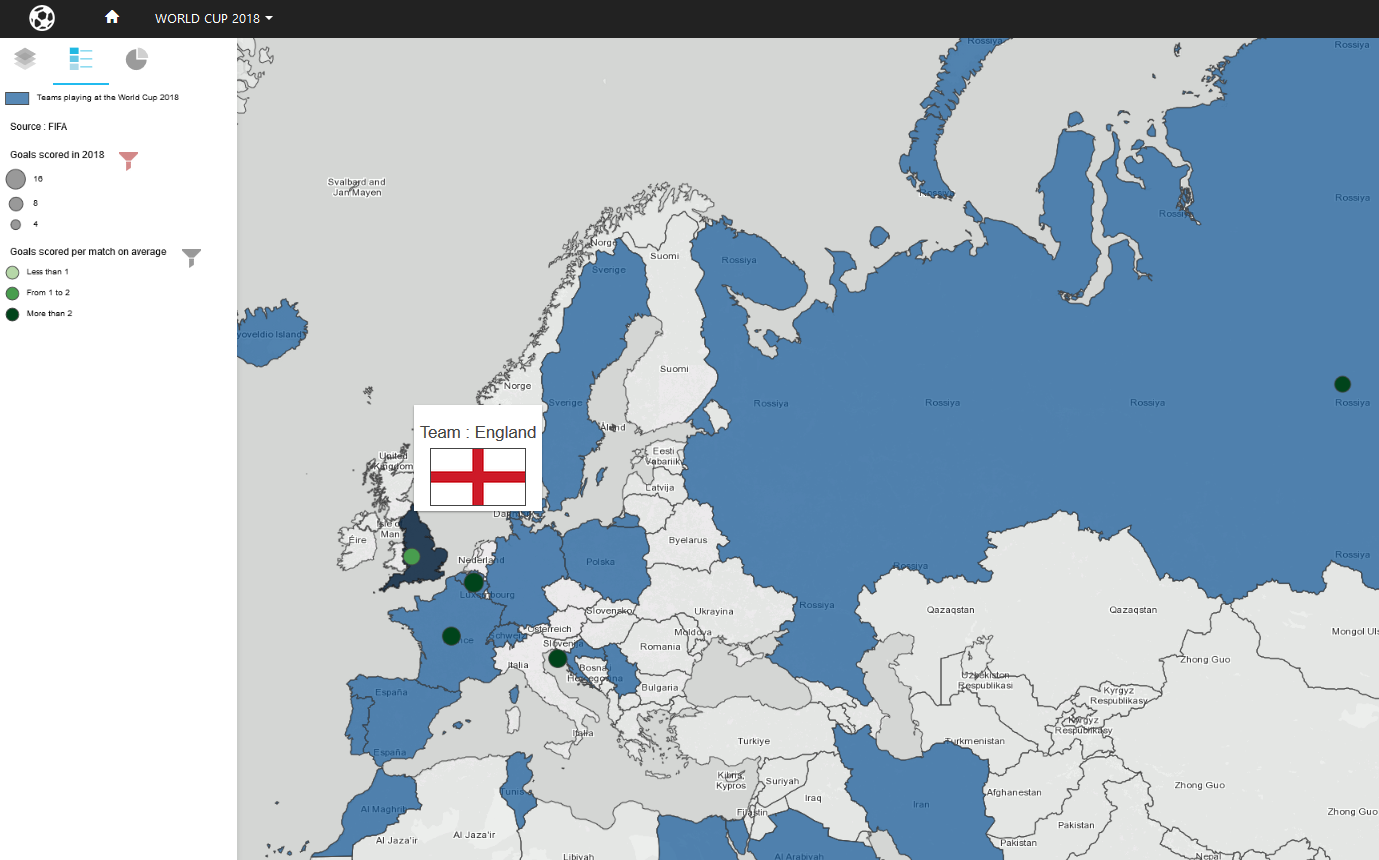
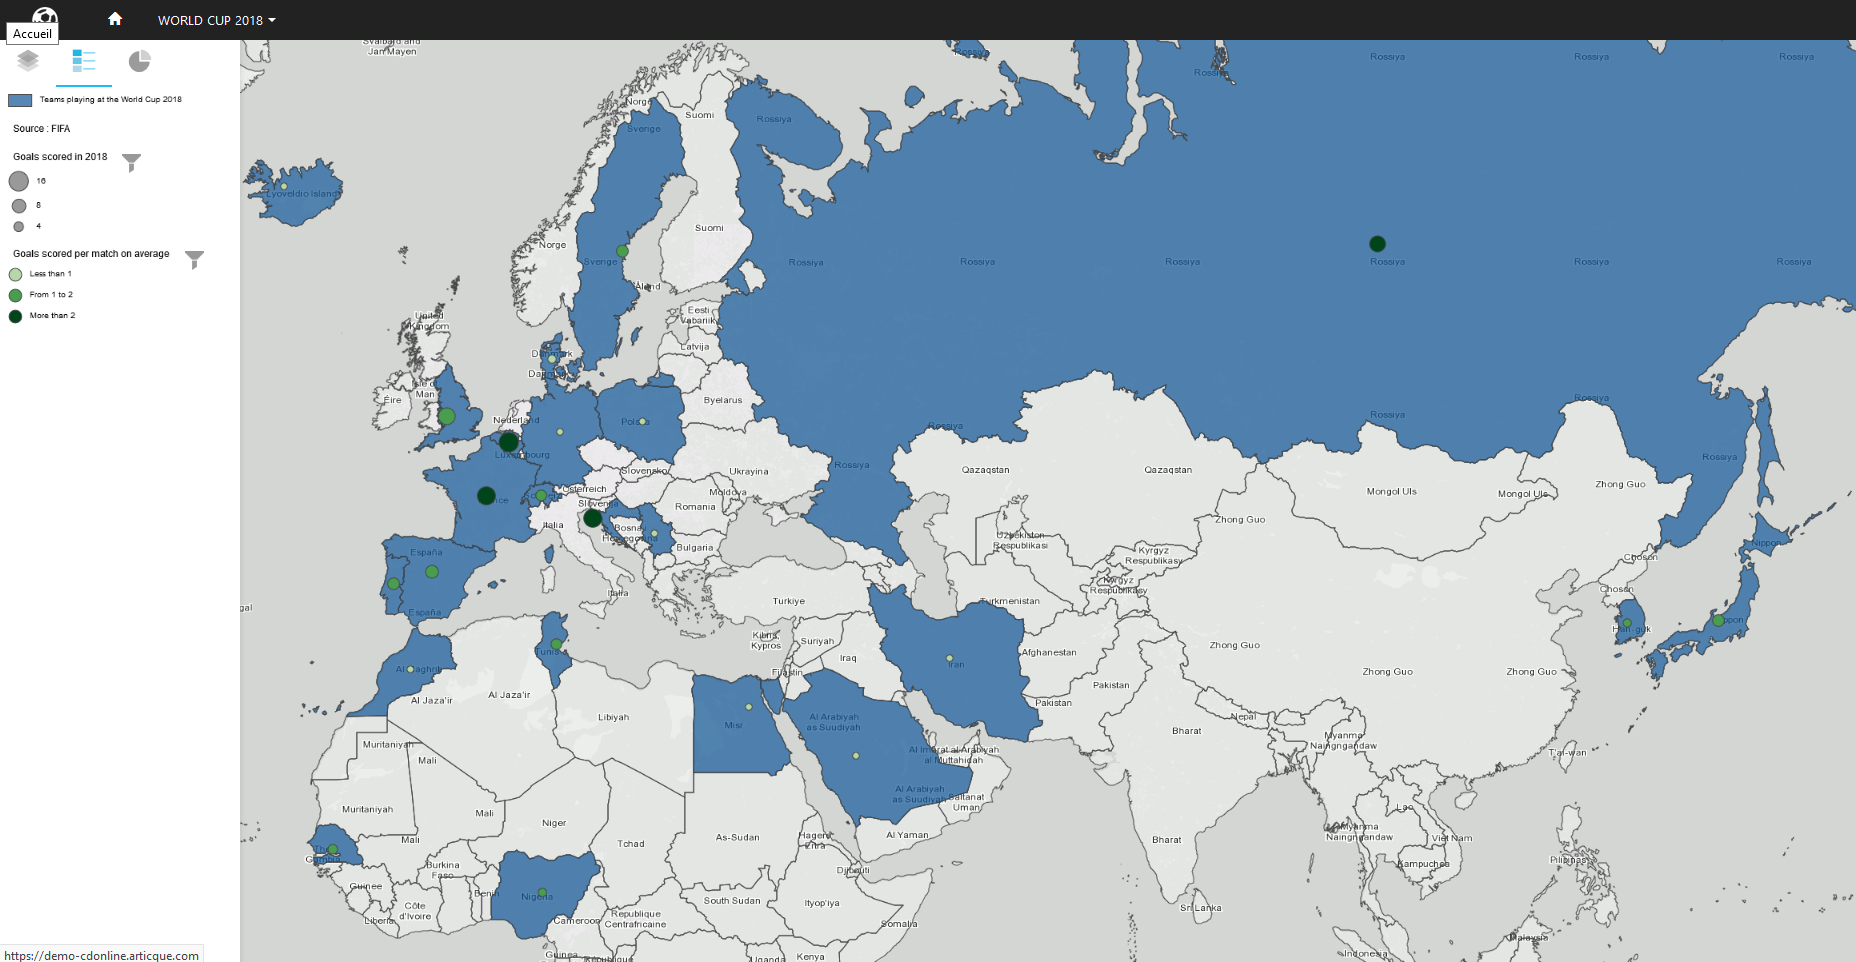
Discover the number of goals scored by each country, and the average number of goals per game. For example, let’s have a look at Belgium and England, who were both semi-finalists and participated in the third-place play-off, with a total of 7 games played each: Belgium scored 16 goals during the World Cup, or an average of 2.28 goals per game, while England scored 12 goals: an average of 1.71 goals per game.
A map of the number of goals scored by European teams.
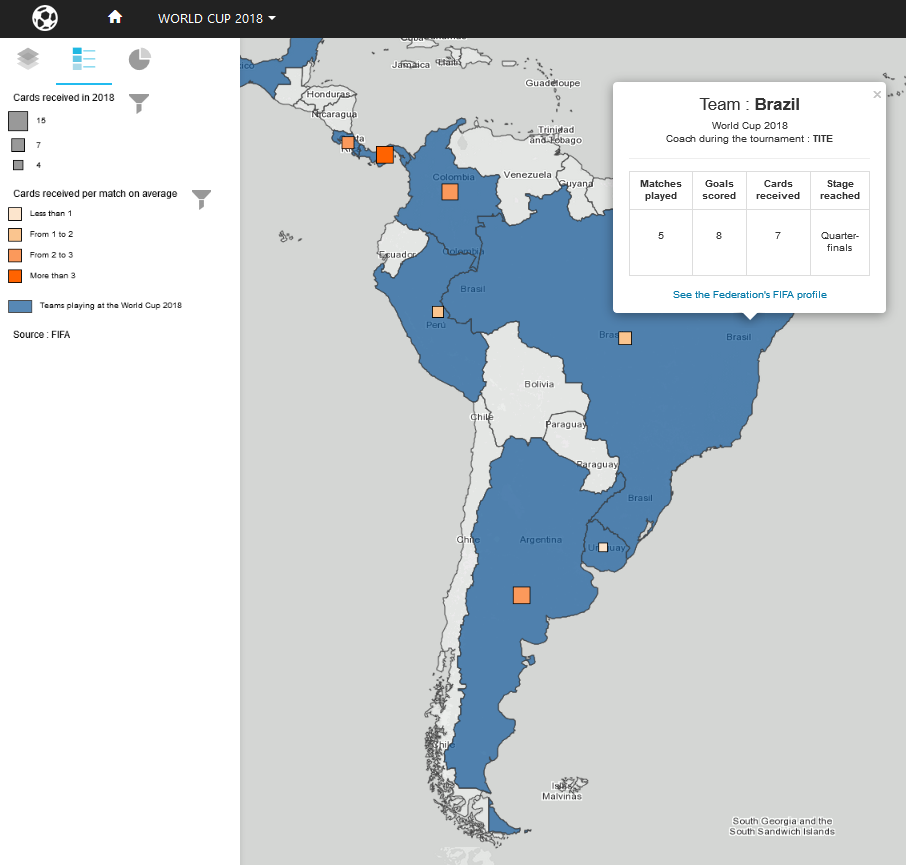
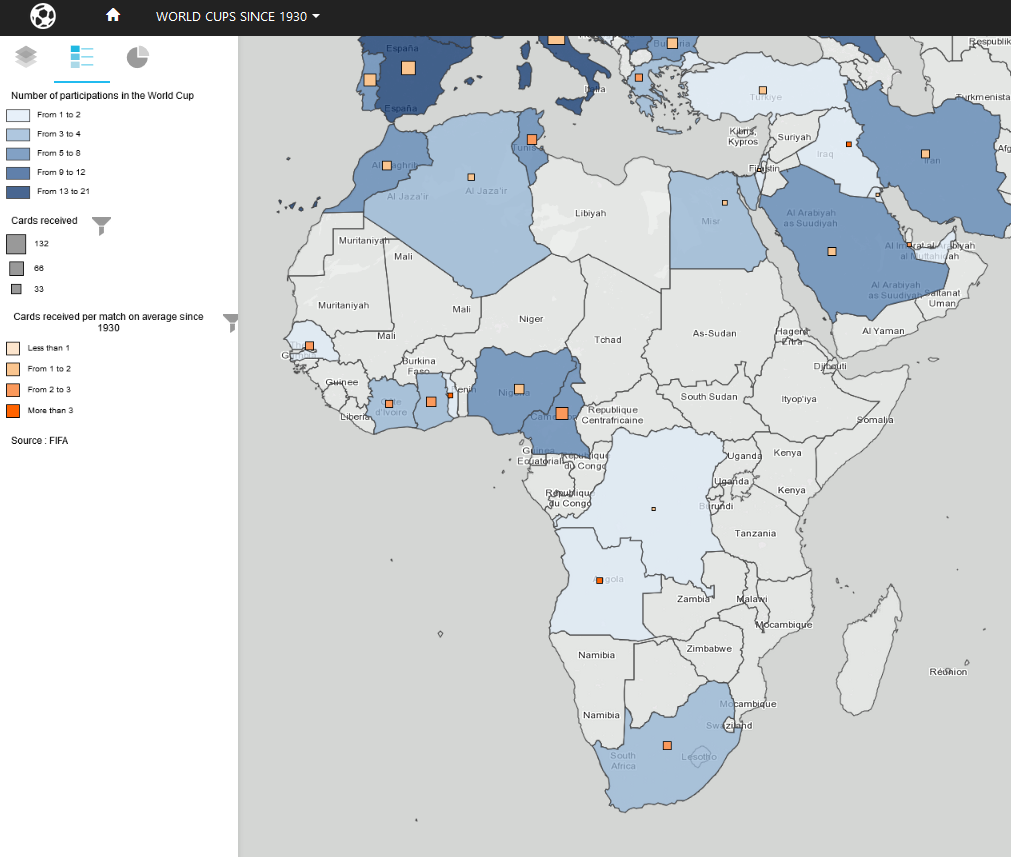
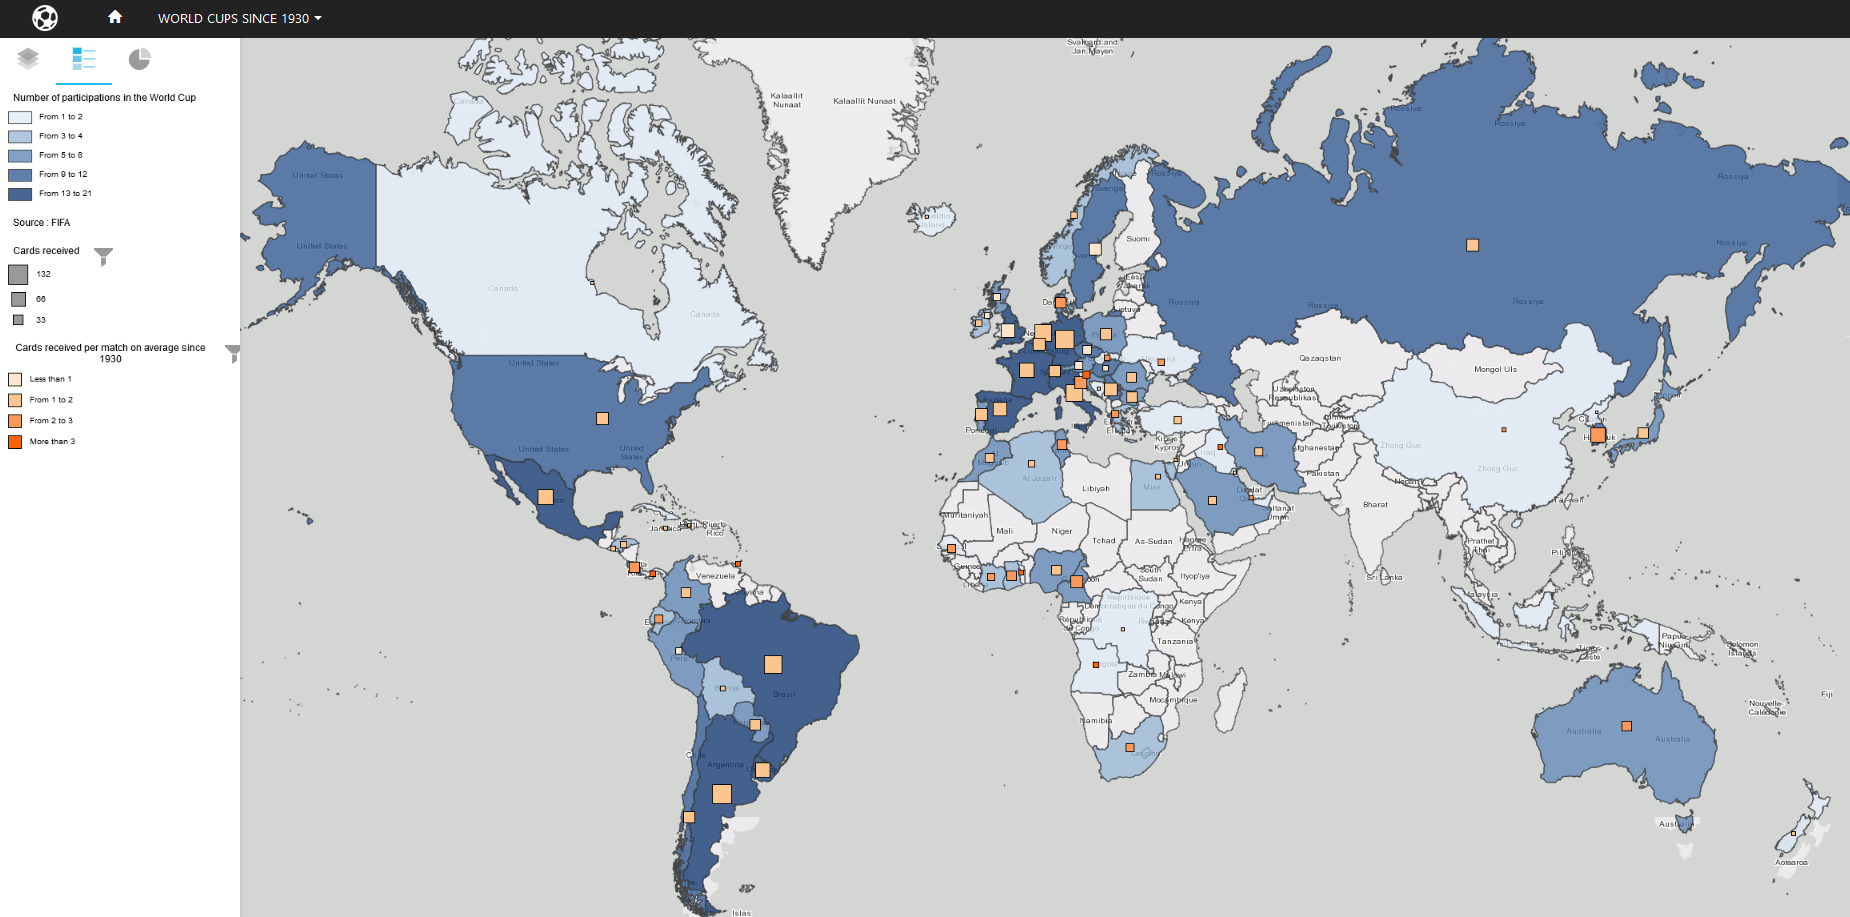
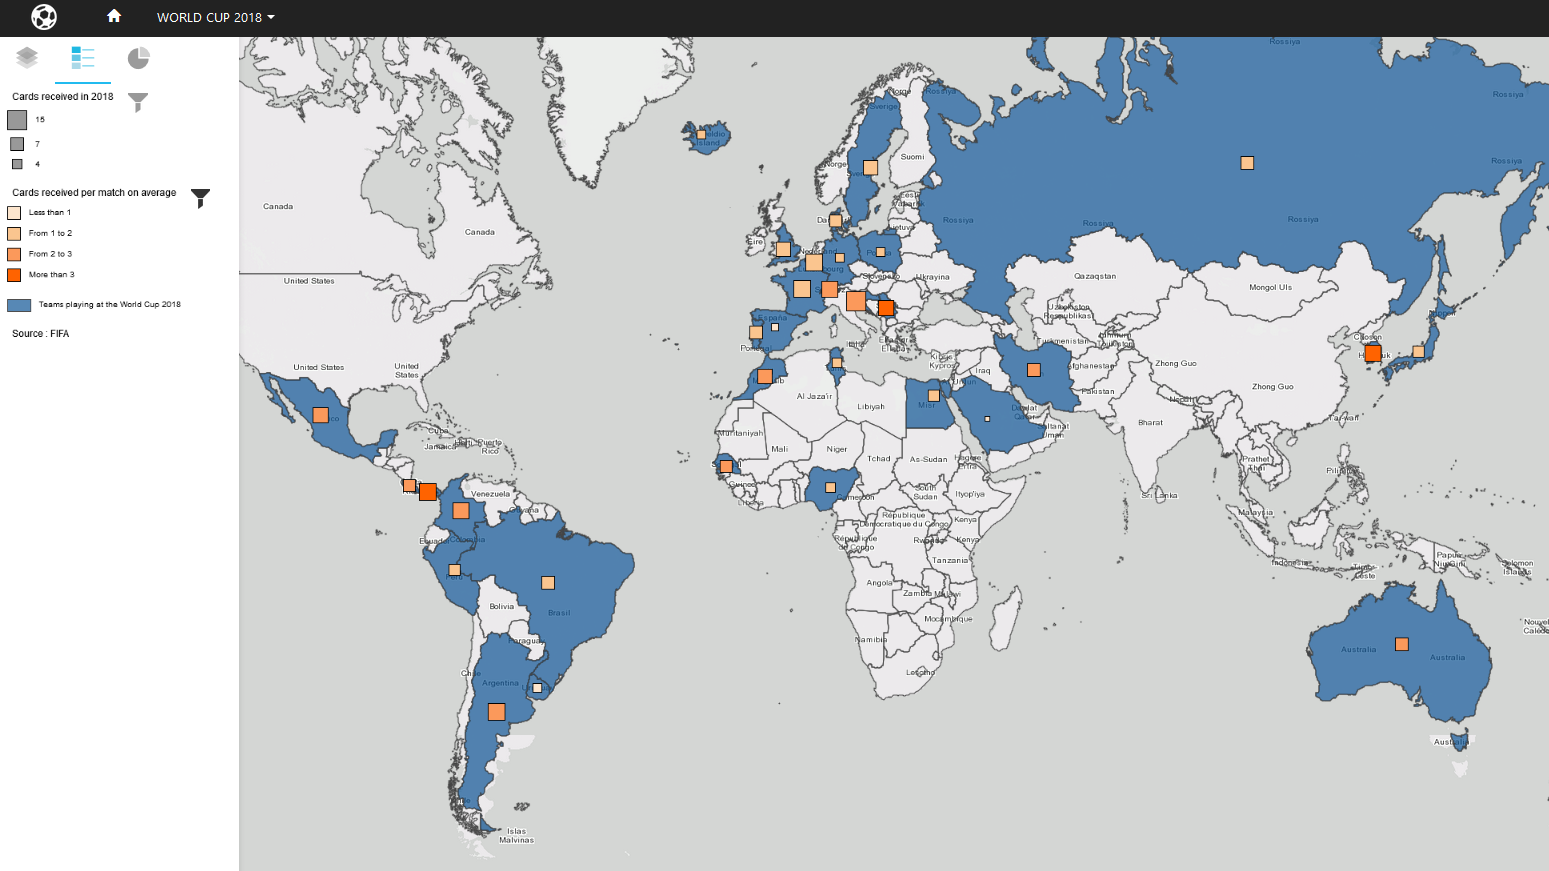
You can also have a look at the number of cards each team received during the tournament, and at the average number of cards received per game. Which countries got less than a card per game on average? Or more than three?
A map of the number of cards received by South-American and Central American teams.
Panama received 11 cards in 3 games, or an average of 3.6 cards per game, while Uruguay received only 3 cards in 5 games, or an average of 0.6 cards per game.
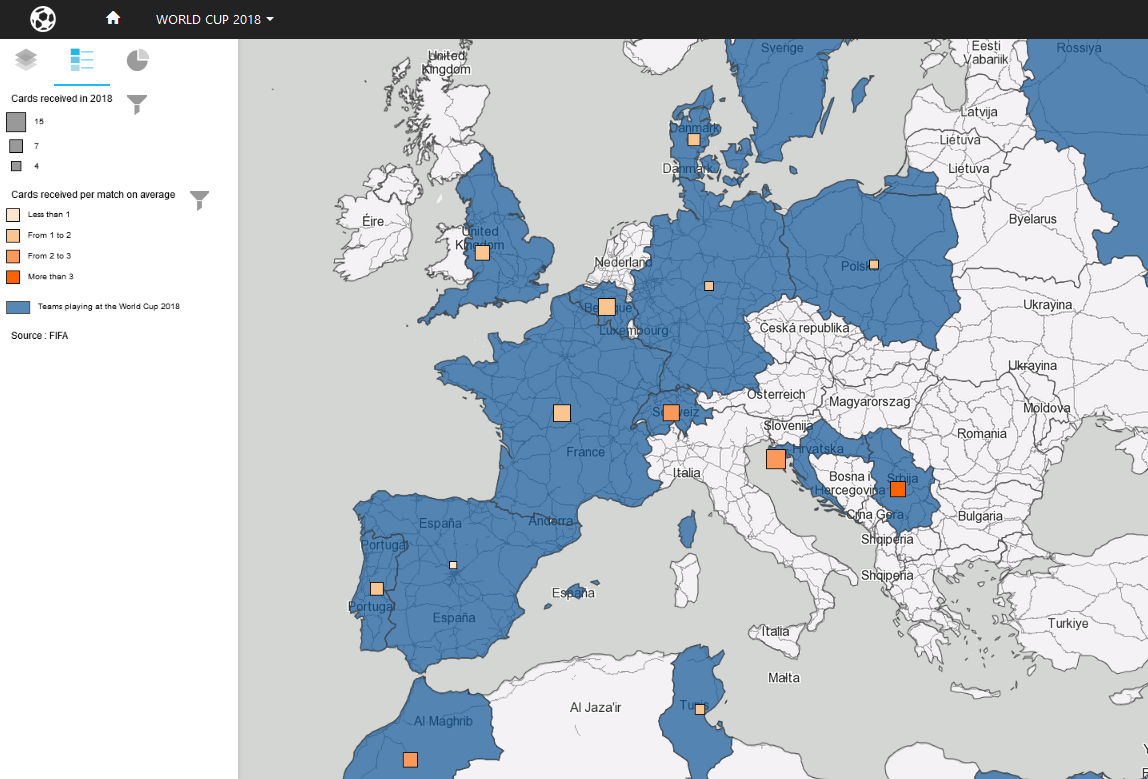
A map of the cards received during the World Cup by European teams.
The finalists, France and Croatia, both played 7 games. France received 12 cards, or an average of 1.71 cards per game, while Croatia received 15 cards, or 2.14 cards per game on average…
You can see the detailed figures by clicking on countries. You will also find a link to the FIFA information sheet of the country’s federation. All data used in this atlas comes from the FIFA website.


